Abstract
Post-conflict landscapes often contain long-term environmental and safety risks that are difficult to detect and map using traditional field-based methods. These risks are spatially distributed, visually ambiguous, and influenced by environmental changes over time.
This case study presents an AI-based geospatial intelligence system that uses satellite imagery, drone data, and machine learning models to detect terrain anomalies, analyze spatial clustering behavior, and generate probabilistic risk maps.
The system is designed to support humanitarian planning and decision-making by converting raw geospatial data into structured, interpretable risk intelligence.
1. Introduction
Large regions affected by past conflicts often remain difficult to analyze even after active events have ended. These environments may contain hidden or partially visible hazards that are spread across large geographic areas.
Manual inspection of such environments is slow, expensive, and often unsafe. In addition, natural changes in terrain such as vegetation growth, erosion, and seasonal variations make detection even more complex.
Because of these limitations, there is a growing need for automated systems that can analyze geospatial data at scale.
Artificial intelligence provides a solution by enabling remote analysis of satellite and drone data to identify patterns that are not easily visible to humans.
2. Problem Statement
The main objective of this system is:
How can we detect, analyze, and predict spatial risk zones in large and complex geographical environments using multi-source geospatial data?
This problem includes several challenges:
Limited labeled training data from real environments
Large-scale and high-resolution imagery requirements
Visual ambiguity in natural terrain
Temporal changes in environmental conditions
Uncertainty in model predictions
The goal is not only detection, but also understanding how risk is distributed and evolves over space.
3. System Overview
The proposed solution is a multi-layer AI pipeline designed for geospatial risk intelligence.
System Architecture
Satellite Imagery + Drone Data + GIS Information
                    ↓
          Data Preprocessing Layer
                    ↓
           AI Feature Extraction
                    ↓
        Spatial Pattern Analysis
                    ↓
        Cluster-Based Risk Modeling
                    ↓
           Risk Score Generation
                    ↓
         Geospatial Risk Mapping
                    ↓
        Human Expert Validation
This architecture ensures that raw geospatial data is transformed into structured, interpretable outputs.
4. Data Sources
4.1 Satellite Imagery
Satellite data provides large-scale coverage of terrain and allows for historical comparison over time. It is used to observe:
land structure changes
environmental variations
large-area spatial patterns
4.2 Drone Imagery
Drone data provides high-resolution, localized views of terrain. It is useful for:
validating satellite predictions
detailed inspection of smaller regions
improving spatial accuracy
4.3 GIS Data
Geographic Information System (GIS) data provides structured environmental information such as:
elevation models
land usage patterns
terrain classification
environmental context
5. Data Preprocessing
Before AI processing, raw data must be standardized and cleaned.
The preprocessing stage includes:
Coordinate system alignment across datasets
Noise removal such as clouds, shadows, and distortions
Image tiling for large-scale processing
Temporal alignment of multi-date datasets
This step ensures consistency and improves model reliability.
6. AI Detection Layer
This layer is responsible for identifying patterns and anomalies in geospatial data.
Models used:
Convolutional Neural Networks (CNNs) for spatial feature extraction
Vision Transformers (ViTs) for large-scale contextual understanding
AI detection tasks:
identifying terrain irregularities
detecting surface-level anomalies
comparing changes across time periods
extracting spatial features from complex landscapes
The output is a set of detected features representing potential areas of interest.
7. Spatial Pattern and Cluster Analysis
Rather than analyzing individual points, the system focuses on spatial relationships.
The AI performs:
clustering of similar anomalies
density estimation of spatial patterns
grouping of nearby risk indicators
This transforms isolated detections into structured spatial regions.
The result is a shift from point-based detection to region-based understanding.
8. Risk Prediction Model
Each spatial cluster is assigned a probability-based risk score.
Example output:
RegionRisk ScoreInterpretationZone A0.92High RiskZone B0.61Medium RiskZone C0.18Low Risk
These values represent probabilistic estimates rather than fixed classifications.
This approach helps decision-makers prioritize areas effectively.
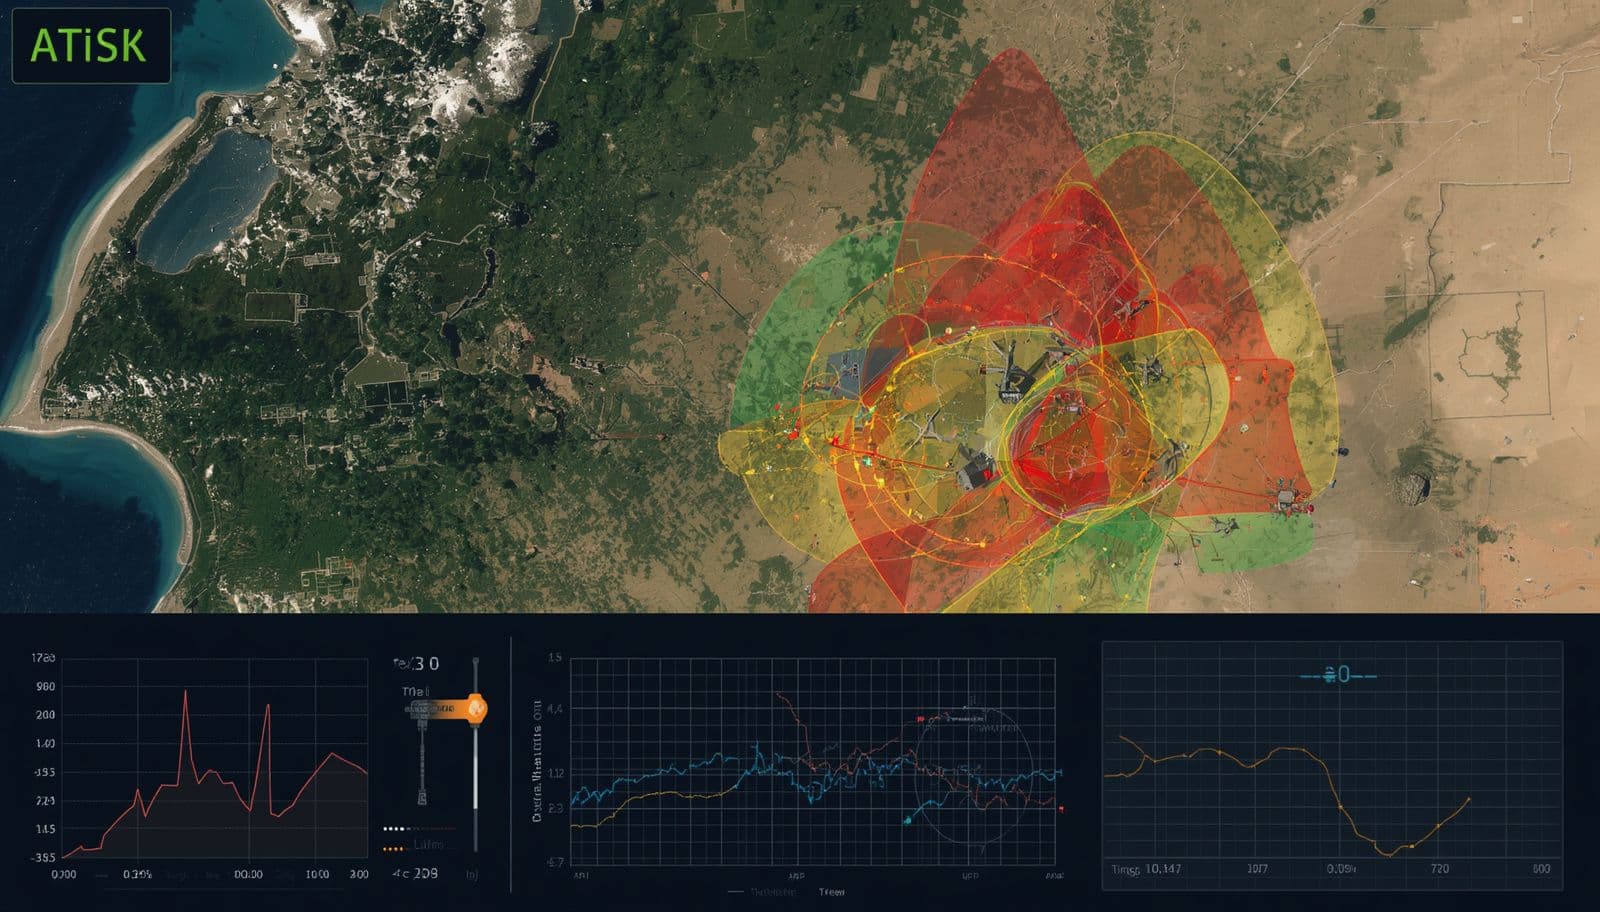
9. Geospatial Risk Mapping
The final output is a layered risk map used for visualization and decision support.
Risk zones are represented as:
High-risk regions (red zones)
Medium-risk regions (yellow zones)
Low-risk regions (green zones)
These maps allow users to quickly understand spatial risk distribution across large areas.
10. Human-in-the-Loop Validation
AI predictions are reviewed by human experts to ensure reliability.
Human validation is used to:
verify AI outputs
correct false detections
improve system accuracy over time
This creates a hybrid intelligence system combining machine learning and expert knowledge.
11. Challenges
Despite strong performance, the system faces several challenges:
Limited real-world labeled datasets
Environmental interference such as vegetation and weather
High uncertainty in complex terrain
Variation across geographic regions
Difficulty in ground-truth validation
These challenges require continuous model improvement and adaptation.
12. Benefits of the System
This AI-based geospatial system provides several important benefits:
Faster analysis of large geographic regions
Improved safety through early risk identification
Reduced dependency on manual field surveys
Better prioritization of inspection areas
Data-driven decision support for planning
13. Future Enhancements
Future versions of such systems may include:
Real-time satellite monitoring systems
Autonomous drone-based scanning networks
Self-learning geospatial AI models
Continuous global risk intelligence platforms
Integration with emergency response systems
14. Conclusion
This case study demonstrates how artificial intelligence can transform complex geospatial data into structured and meaningful risk intelligence.
By combining satellite imagery, drone data, and machine learning models, the system enables:
detection of spatial patterns
identification of clustered anomalies
prediction of risk-prone regions
support for safer and faster decision-making
In simple terms, AI helps convert large, complex landscapes into understandable risk maps that support humanitarian and planning operations.
References
Goodchild, M. F. (2018). Geographic Information Systems and Science
Long, J. et al. Fully Convolutional Networks for Image Segmentation
Dosovitskiy, A. et al. Vision Transformers (2020)
IEEE Transactions on Geoscience and Remote Sensing
NASA Earth Observation Data Systems
Remote Sensing of Environment (Elsevier Journal)
UN Geospatial and Humanitarian Mapping Reports
Enjoyed this article? Share it: